Contributed by the ToWards Inclusive Growth team, including Jon Hopkins (Hutton), Andy Sarjeant (HIE) and Eilidh MacDonald (HIE)
Places in Scotland have often been defined as disadvantaged or vulnerable based on an “in or out” classification, often using a threshold level. Small areas in the north and west of Scotland, for example, have been classified as fragile based on a score calculated from recent population change, access to services, income and unemployment. Although this definition is well-used, binary classifications are inevitably limited. For example, they don’t capture variation in the extent of fragility, describe how different indicators interact, or identify challenges faced in areas which don’t reach the fragility threshold. Broadly, they inhibit a more targeted and balanced approach to intervention based on opportunities and needs.
Another widely-known indicator, the Scottish Index of Multiple Deprivation (SIMD), provides a ranking of all Data Zones in Scotland and considers seven domains. However, reporting of the SIMD regularly emphasises the extremes – such as ‘top tens’ and the most deprived 20% of Scotland. In this project, our aim is to produce a more nuanced typology of small areas in the Highlands and Islands, representing areas with similar characteristics related to inclusive growth. To provide a framework for data analysis, it was vital to consider which characteristics and themes are most relevant.
While inclusive growth is a fuzzy concept, attempts have been made to operationalise and measure it. The increasing policy interest in Scotland is evidenced by the production of an outcomes framework by Scotland’s Centre for Regional Inclusive Growth (SCRIG), consisting of five outcomes (‘5 Ps’ of productivity, population, participation, people and place) to “…provide a consistent structure for analysis and understanding of inclusive growth performance”. The framework includes two key contexts: people and place, emphasising the need to consider the outcomes from the view of different groups and locations. This framework is accompanied by an Inclusive Growth Outcomes Framework Dashboard, an attractive online application enabling access to data for 26 indicators. However, no indicators are available for areas smaller than local authorities. This is not a criticism, as the developing inclusive growth research community in Scotland has prioritised the development and improvement of the evidence base. However, for the purposes of creating a small area-resolution typology, we decided to consider other frameworks.
Broadly, inclusive growth aims to address two elements – “…the pace and pattern of growth” – at the same time, by supporting higher quality employment across the economy rather than redistributing income. Similarly, a review for the Poverty and Equality Commission summarised inclusive growth as “…about delivering an economy that combines fairness and prosperity and about economic growth that narrows inequalities by design” before welfare intervention. The assumptions behind this view should be challenged, of course – however the focus on ‘pace’ and ‘pattern’ (or ‘quantity’ and ‘quality’) of development are extremely useful themes to frame the concept, and other analyses have used similar approaches. These include the Joseph Rowntree Foundation’s Inclusive Growth Monitor for English regions, which uses a series of indicators structured within two themes of inclusion and prosperity. The same two themes are also included within the Metro Monitor, an annual analysis by the Brookings Institution of the largest 100 cities in the USA.
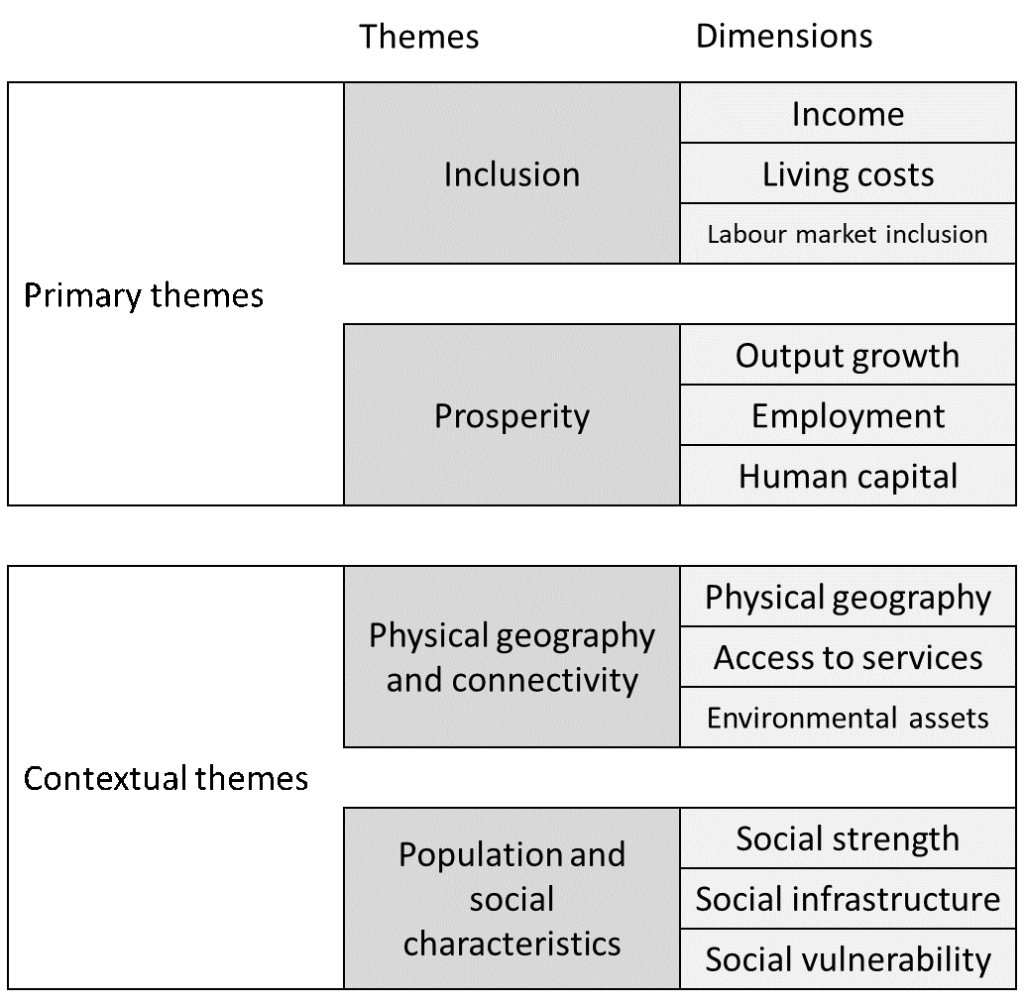
The framework for analysis in this project reproduces the themes and dimensions of the Inclusive Growth Monitor. In our framework, prosperity consists of output growth (potentially measured by business activity and earnings), characteristics of employment, and human capital – the skills and abilities of people. Inclusion can be defined through evidence of (low) income, living costs (for instance, housing affordability) and labour market inclusion, potentially measured by employment and economic activity rates. In addition to representing these dimensions with suitable indicators, measuring local-level spatial variability is crucial in understanding inclusive growth, as residents’ local experiences and knowledge of nearby regions influence their perceived quality of life (see: report, article).
However, in order to increase the relevance of this framework to the Highlands and Islands, we have concluded that it is crucial to include two additional contextual themes which describe a location’s geographical and social characteristics. Increasing inclusion and prosperity can be the focus of interventions and investments (potentially guided by a suitable small area typology), but the additional contextual factors of geographical and social characteristics represent elements which can be less easily influenced by local-level actions (although they are not necessarily ‘static’). They can be major assets or challenges to communities, or factors which influence community resilience, capacity, or vulnerability.
The Highlands and Islands contains the city of Inverness and several towns, but also extensive sparsely populated areas and the vast majority of Scotland’s inhabited islands: access to services, digital connectivity, and the quality of transport infrastructure vary considerably. In addition, the landscape contains major environmental assets which may deliver community benefits: forests and peatlands, protected areas, and high potential for renewable energy.
Additionally, the strength and cohesiveness of communities and the availability of ‘social infrastructure’ (e.g. community centres, libraries) may affect local-level outcomes. We also feel that a greater understanding of potential social vulnerability: possibly indicated by the local population’s age structure, health outcomes, selected protected characteristics, and the availability of transport for those without cars, is crucial; as sustainable community development and genuinely inclusive growth needs to account for the needs and experiences of vulnerable groups, in addition to considering the availability of ‘human capital’. As inclusive growth can be conceptualised as addressing both regional and social inequalities, additional contextual indicators add important detail.
This framework, following review, will be used as a basis for indicator selection, and data analysis, which will be used to develop a set of typologies for the Highlands and Islands that represent areas with similar characteristics in terms of inclusion and prosperity, set in the context of the landscape and society and accompanied by a clear narrative description. The framework is aspirational, as ‘fine grained’ data, for small areas, is not likely to be available for all twelve dimensions: some compromises and adjustments will need to be made. We aim to develop and publish the typologies soon.
Note: this is the second blog from the ‘Towards Inclusive Growth’ project, funded by the SEFARI Responsive Opportunity Initiative. Through this project, researchers from the Social, Economic and Geographical Sciences Group at the James Hutton Institute and Biomathematics & Statistics Scotland are working with researchers, economists and policy staff within HIE’s Planning and Partnerships team to create new knowledge about the characteristics of inclusive growth within the Highlands and Islands. This is our second blog from the project – the first followed a workshop in Aberdeen at the start of March. Since then, discussions and knowledge exchange have been necessarily online.