Jonathan Hopkins from The James Hutton Institute invites your feedback on an interactive map showing local-level indicators of wellbeing. Explore the map here, read the information sheet here, and take the survey here.
There are several reasons why access to detailed information about places and communities – for small areas well below the national level – is hugely valuable. In the context of inclusive growth and wellbeing, researchers at the OECD have made three relevant observations: firstly, the location where people live has a considerable influence on their quality of life and opportunities. Secondly, government policies are not implemented in the same way in all areas, and the decisions and investments of local policy makers (including Scotland’s councils) have a major impact on residents. Thirdly, country-level information often masks major inequality between regions.
The last of these three points is particularly salient, as issues of economic and social inequality are rightly high on the policy agenda, partly due to the correlation between regional decline and political populism. In February 2020, an independent academic inquiry into spatial inequality in the UK – the UK2070 Commission – published its final report. This highlights the cost of the extreme regional differences in wealth and investment within the UK, with strong development in London and urban areas in the south, contrasting with consistent difficulties experienced by northern cities and several smaller towns in older industrial areas and more isolated (often coastal) locations. In the context of threats and opportunities presented by future population growth and the urgency of reducing carbon emissions, the Commission has recommended radical and broad changes in areas such as governance, transportation, investment and housing policy.
Researchers in the Social, Economic and Geographical Sciences (SEGS) group at The James Hutton Institute are involved in research on place-based policies – development approaches designed for different local contexts through collaborative knowledge creation. As described by Jane Atterton, place-based policies in Scotland are not new, as urban regeneration schemes took place in the 1960s, but they have increased in popularity in the past decade. Modern place-based policies acknowledge the diversity of rural areas, and focus on improving several aspects of wellbeing. Place-based policies need to be designed and evaluated using a quality, spatially detailed ‘evidence base’: however, this is not always present in rural Scotland. More nuanced ‘place-sensitive’ policies have also been recommended more recently, which are “…tailored to the structural prospects of different kinds of European regions”: the need for these approaches to be informed by information and intelligence is clear.
As part of research funded by the Scottish Government’s RESAS Strategic Research Programme 2016-2021, we have evaluated how multiple dimensions of wellbeing (defined based on an established OECD framework) can be measured at the ‘local’ or ‘small area’ level, as part of our aim to understand the inequalities in socio-economic outcomes in rural Scotland. It is possible to represent a number of concepts via indicators at the Data Zone level, either through existing statistics or by calculating new indicators, although this is more difficult for concepts such as life satisfaction and environmental wellbeing. However, we have recognised that it is crucial to ensure that socio-economic data is usable and accessible to the diverse communities, practitioners and stakeholders engaged in place-based activities, as access to data supports informed decision-making and community empowerment. Our stakeholder survey, launched in winter 2018 following a workshop at the Scottish Rural Parliament, found that the current online resources for accessing and analysing data are not fully meeting the needs of end users, calling into question whether the benefits of ‘OpenData’ are reaching everyone.
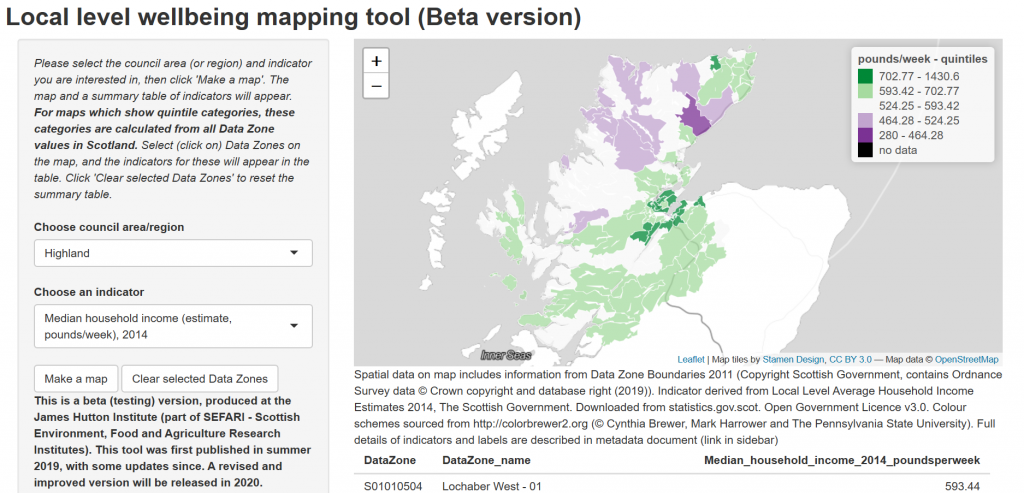
Last year, following the valuable engagement described above, we published an interactive mapping tool in ‘beta’ form which enables end users to produce maps of indicators developed during this research project for regions of their choice, and explore local characteristics. This application does not aim to compete with mapping resources such as the excellent SIMD tool. However, we would like to produce an effective and informative template for publishing multiple indicators and socio-economic datasets. The application was produced using open source software and an improved version could be adopted and developed further by other groups.
In order to improve the tool, we’d be delighted if anyone would like to test the application and fill in a short, anonymous feedback form (https://hutton.qualtrics.com/jfe/form/SV_eLiNtsbakbhzFaZ). If you are interested, please take a look at the information sheet and explore the tool before providing feedback.
If you’d like any other information, or have any questions about our research, please contact jonathan.hopkins@hutton.ac.uk.